Area Chart
ChartsHighlights magnitude under a trend line.
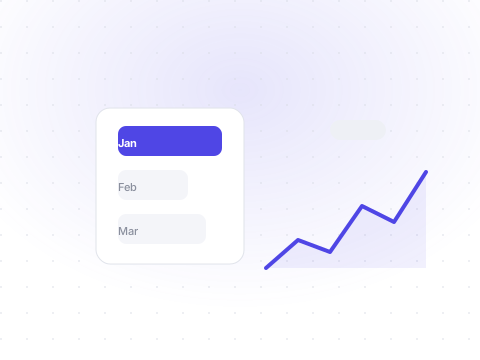
Area charts pair a trend line with a filled region, making volume and cumulative change easy to read. The fill fades from the series color to transparent via an SVG linear gradient.
npx shadcn@latest add area-chartDefault
Subscriber growth with a gradient fill.
Preview
Livetsx
1<AreaChart data={subscribersByMonth} xKey="month" yKey="subscribers" height={220} />
Custom
A flat fill (no gradient) in a different color.
Preview
Livetsx
1<AreaChart2 data={activeUsersByHour}3 xKey="hour"4 yKey="users"5 color="var(--color-chart-4)"6 height={220}7 gradient={false}8/>
API reference
All props of the underlying Base UI primitive are forwarded. The table below documents the Shelf-specific props.
| Prop | Type | Description |
|---|---|---|
| data | Record<string, unknown>[] | The data rows to plot. |
| xKey | string | The key used for the horizontal axis. |
| yKey | string | The key used for the area values. |
| color | string= "var(--color-primary)" | The stroke and gradient base color. |
| height | number= 240 | The chart height in pixels. |
| gradient | boolean= true | Whether the fill fades from the series color to transparent. |